SmartCharge
I led end-to-end research on why EV drivers weren't installing a required data device in a grid-rewards program, then handed the team a few low-effort fixes that lifted average installation rates by 12%.
At a Glance
| Timeline | Under 3 months in 2020 |
| Role | Research Lead (led end-to-end) |
| Team | Cross-functional: program delivery, customer support, and stakeholders across the org |
| Domain | EV charging programs, energy, and utilities (Geotab Energy) |
| Outcome | +12% average device installation rate, above the target benchmark |
Overview
SmartCharge Programs pay EV drivers to charge at times that help the grid, but only if drivers install a small data device in their car. Too many never did, which meant the utility companies funding the program were paying for hardware and getting none of the grid data back. I led a research project to find out why people were not installing the device or were dropping out, and what would move both. The work pointed the team to a few specific, low-effort changes that raised average installation rates by 12%, above the benchmark we set.
My Role & Ownership
Owned
- The research end-to-end: plan, quantitative analysis, qualitative research, synthesis, and recommendations
- Quantitative analysis of program data, including the installation funnel and the per-vehicle breakdown
- Qualitative work: analyzing customer-support feedback, and running in-person interviews and installation observation
- The prioritized set of recommendations handed to the team
Influenced
- Narrowed the program's focus to Tesla drivers, where the data showed the biggest losses
- Set realistic, data-backed improvement targets the team aligned on
- Which fixes the team built first: the redesigned manual and per-vehicle videos
Collaboration
- Program delivery team on the raw program data
- Customer support on participant feedback
- Stakeholders across the org on the research plan, goals, and milestones
- The team that implemented the manual redesign and installation videos
The Problem
SmartCharge Programs (SCP) are how Geotab Energy partners with utility companies across North America to reward EV drivers for charging when it helps the grid. To take part, a driver enrolls an eligible EV, receives a C2 device, and plugs it into the car. The device reports how and when they drive and charge, which is what rewards are calculated from and what utilities use for grid planning.
The program had a leak. A large share of enrolled drivers never installed the device, and others dropped out partway through. That broke the core exchange: utilities paid for the hardware up front but got none of the data they were funding it for.
I stepped up to lead a research project around three questions: why weren't enrolled users installing their devices, why were participants dropping out, and how could we improve both.
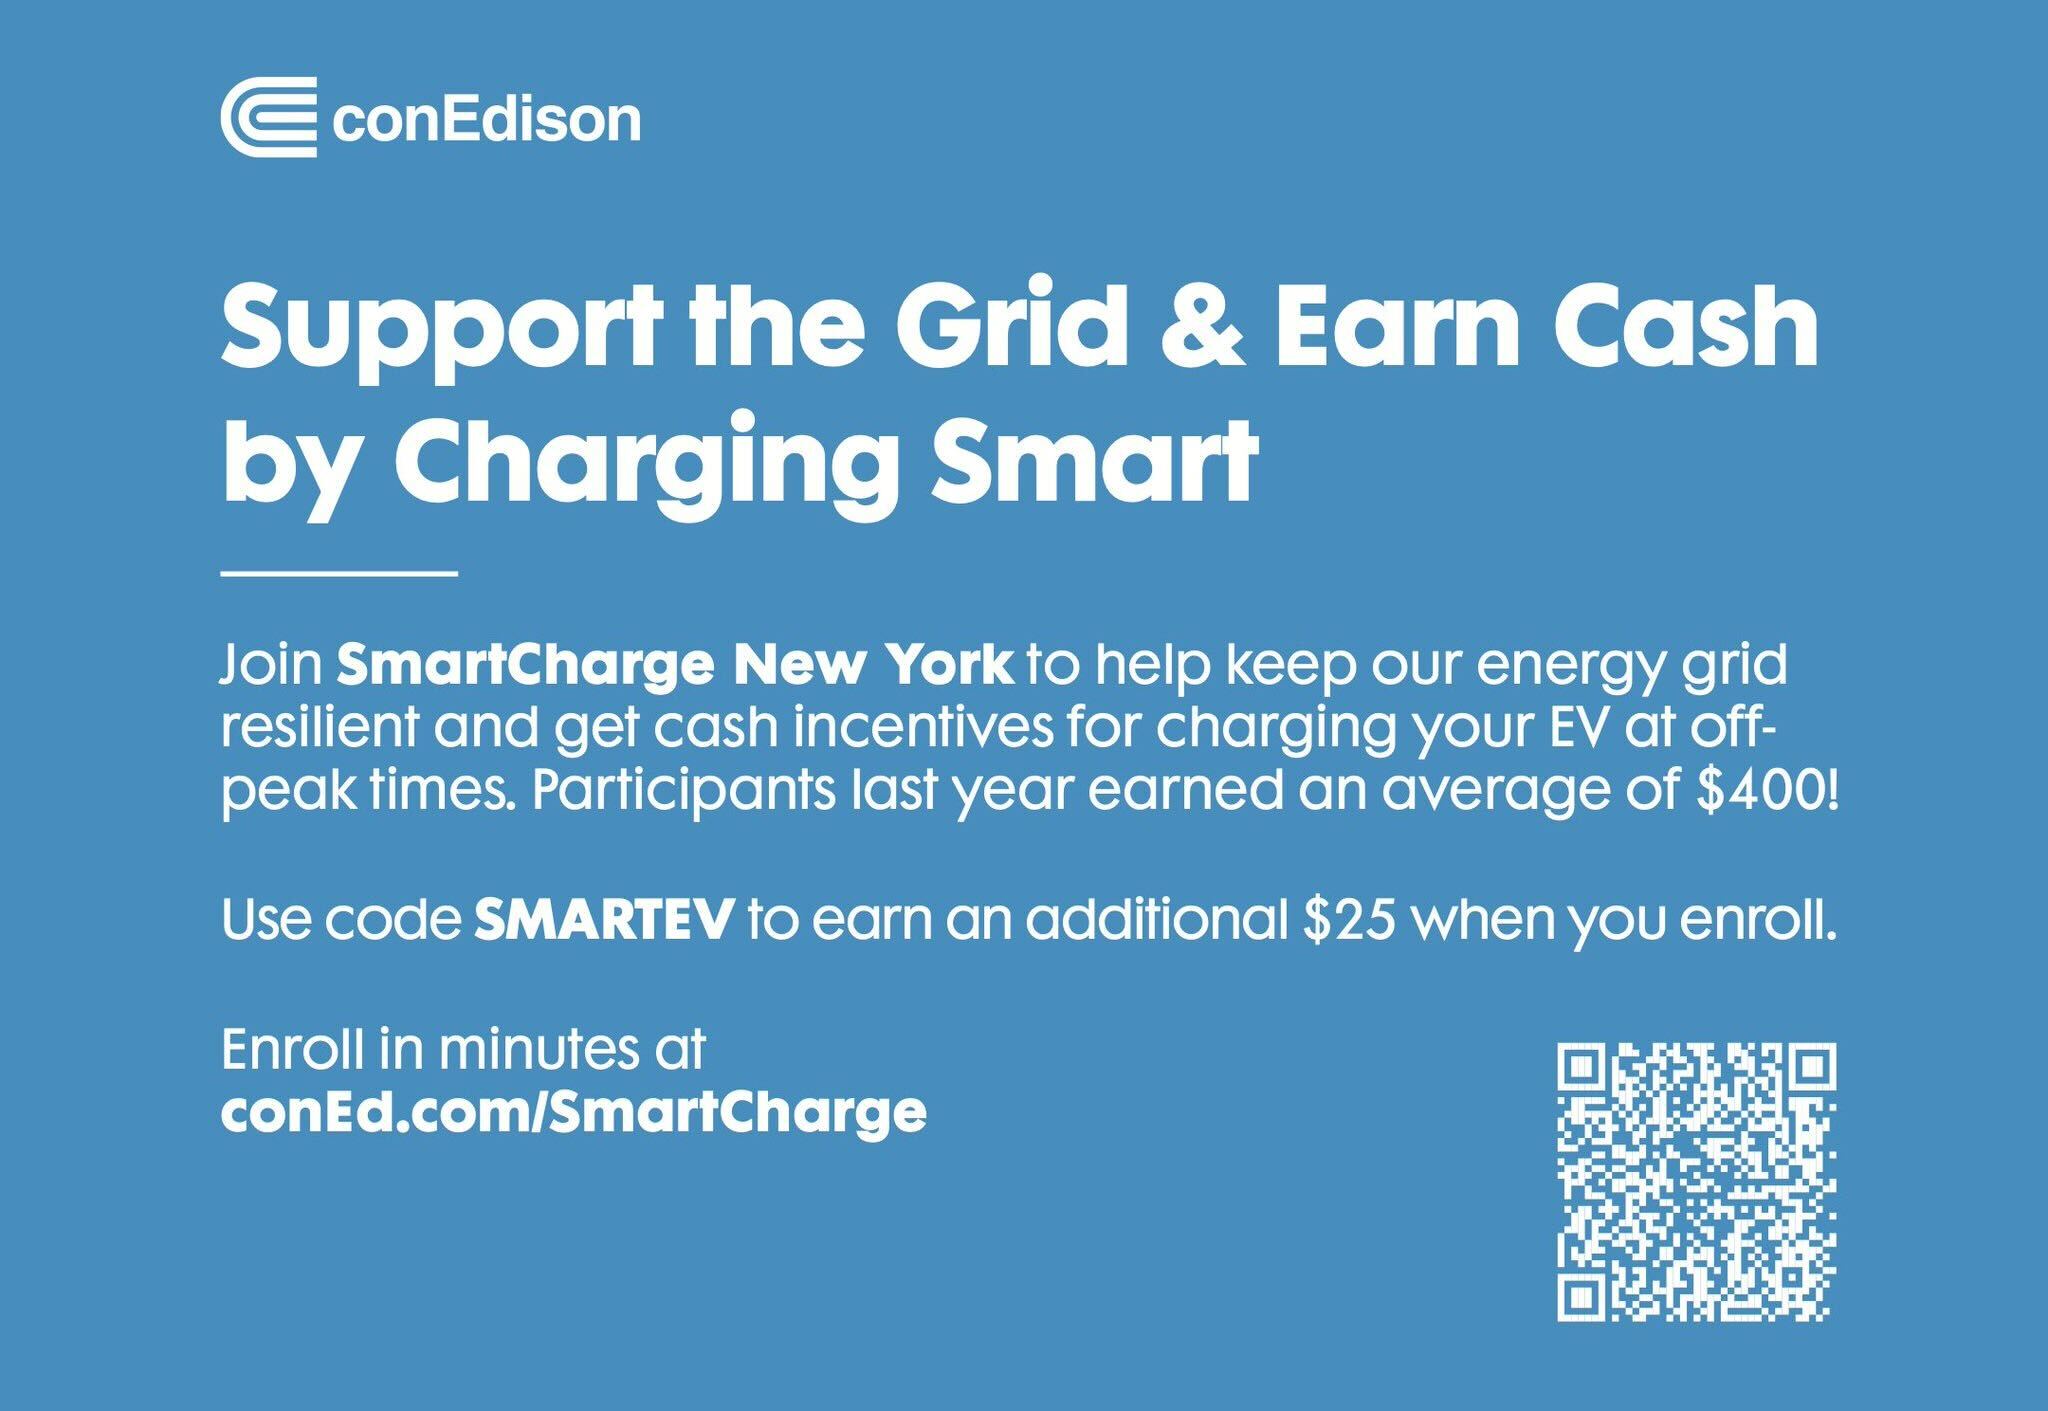
The SmartCharge program and the C2 device
Aligning Before Analyzing
Before any analysis, I wrote a research plan and timeline and walked every key stakeholder through it, so we agreed on goals, milestones, and what to expect. On a cross-functional project with money already spent, that alignment up front is what keeps findings from being argued with later.
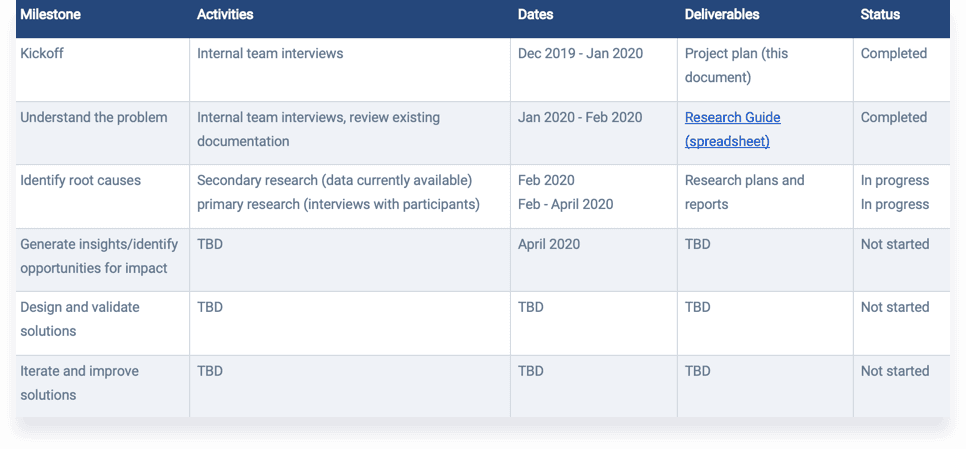
Research plan and timeline shared with stakeholders
Is This Problem Worth Solving?
Before asking anyone to invest in fixes, I wanted to confirm the problem was real and big enough to matter. I pulled raw data from the program delivery team and built the installation funnel: of 4,942 devices delivered, 72% were installed and 28% never were, with total dropouts at 34%.
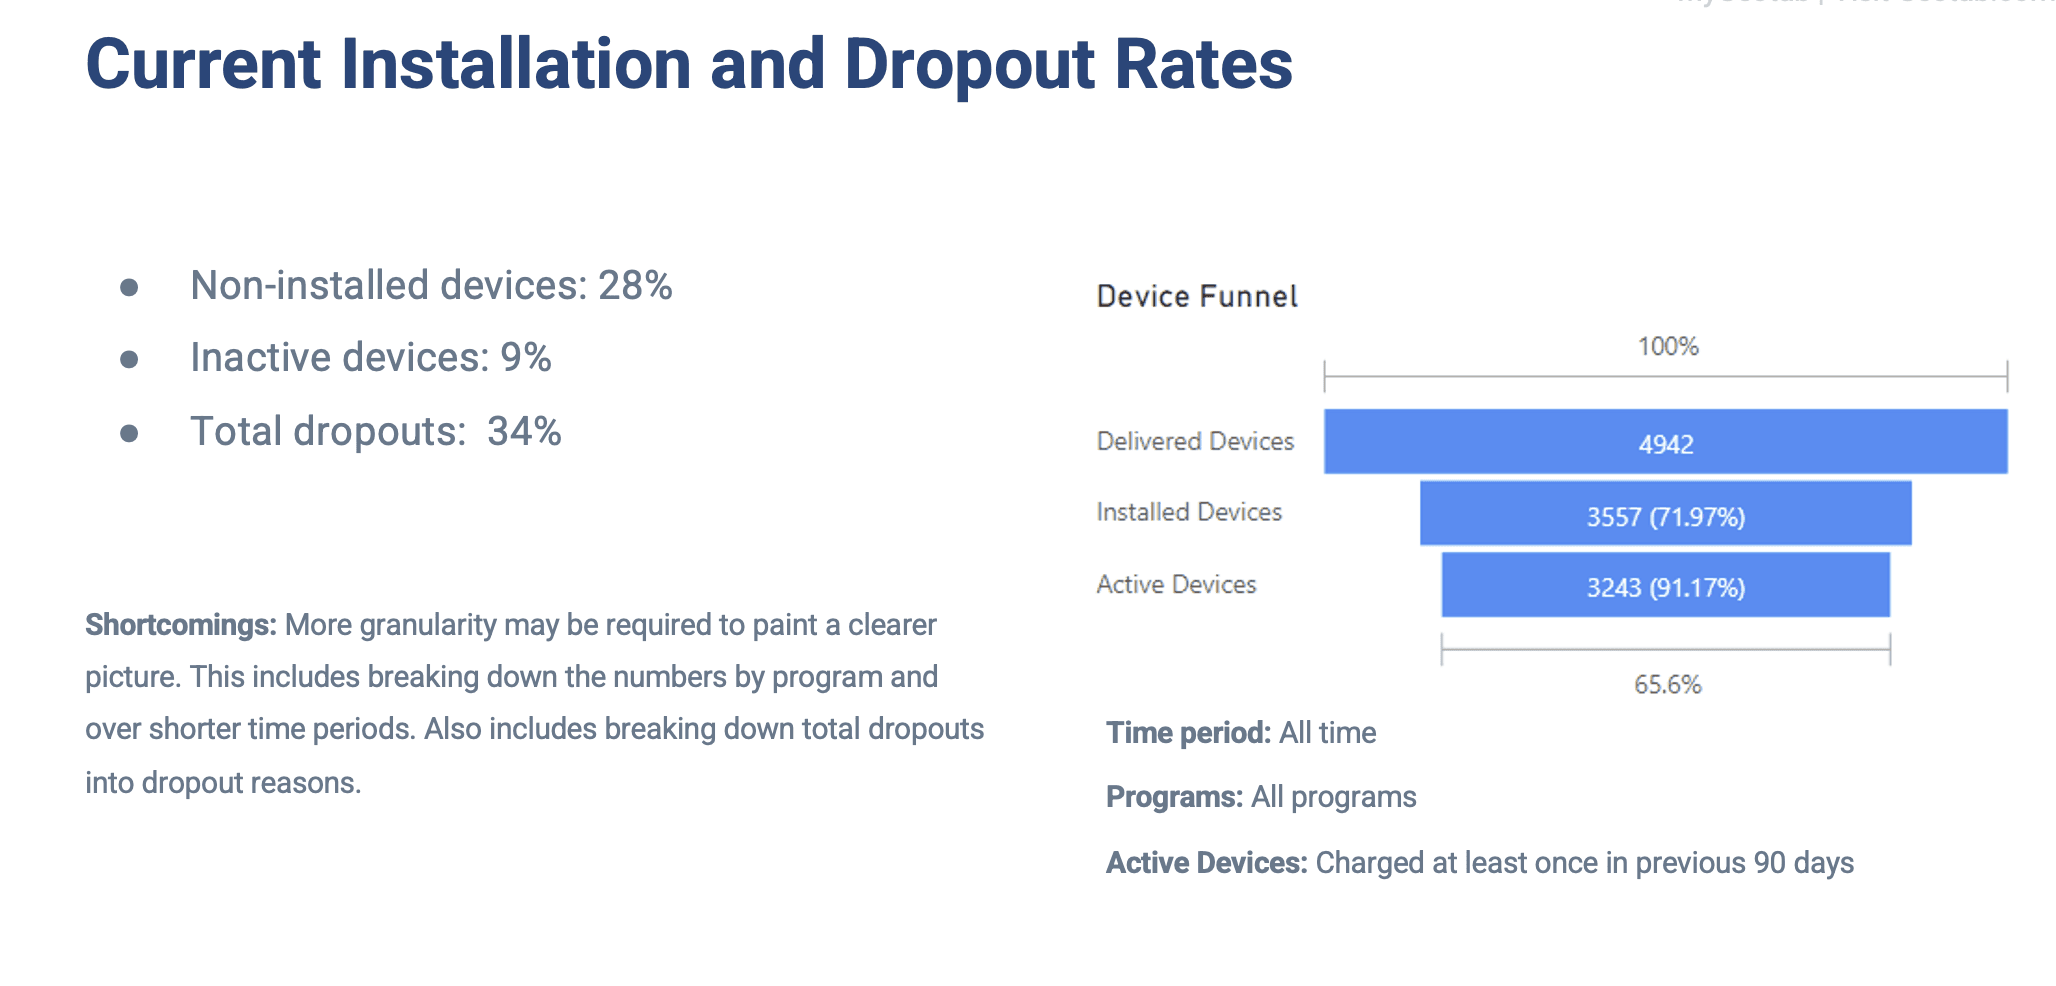
Installation funnel: 4,942 delivered, 28% never installed, 34% dropouts
Where to Aim
That confirmed the problem and let the team set a realistic improvement target instead of a guess. Breaking the same data down by vehicle showed where to aim: Tesla models carried the highest non-installation and drop-off rates, with Model X at 26% and Model 3 at 24%. I focused the research there rather than spreading it thin across every vehicle, because fixing the worst segment would move the overall number most.
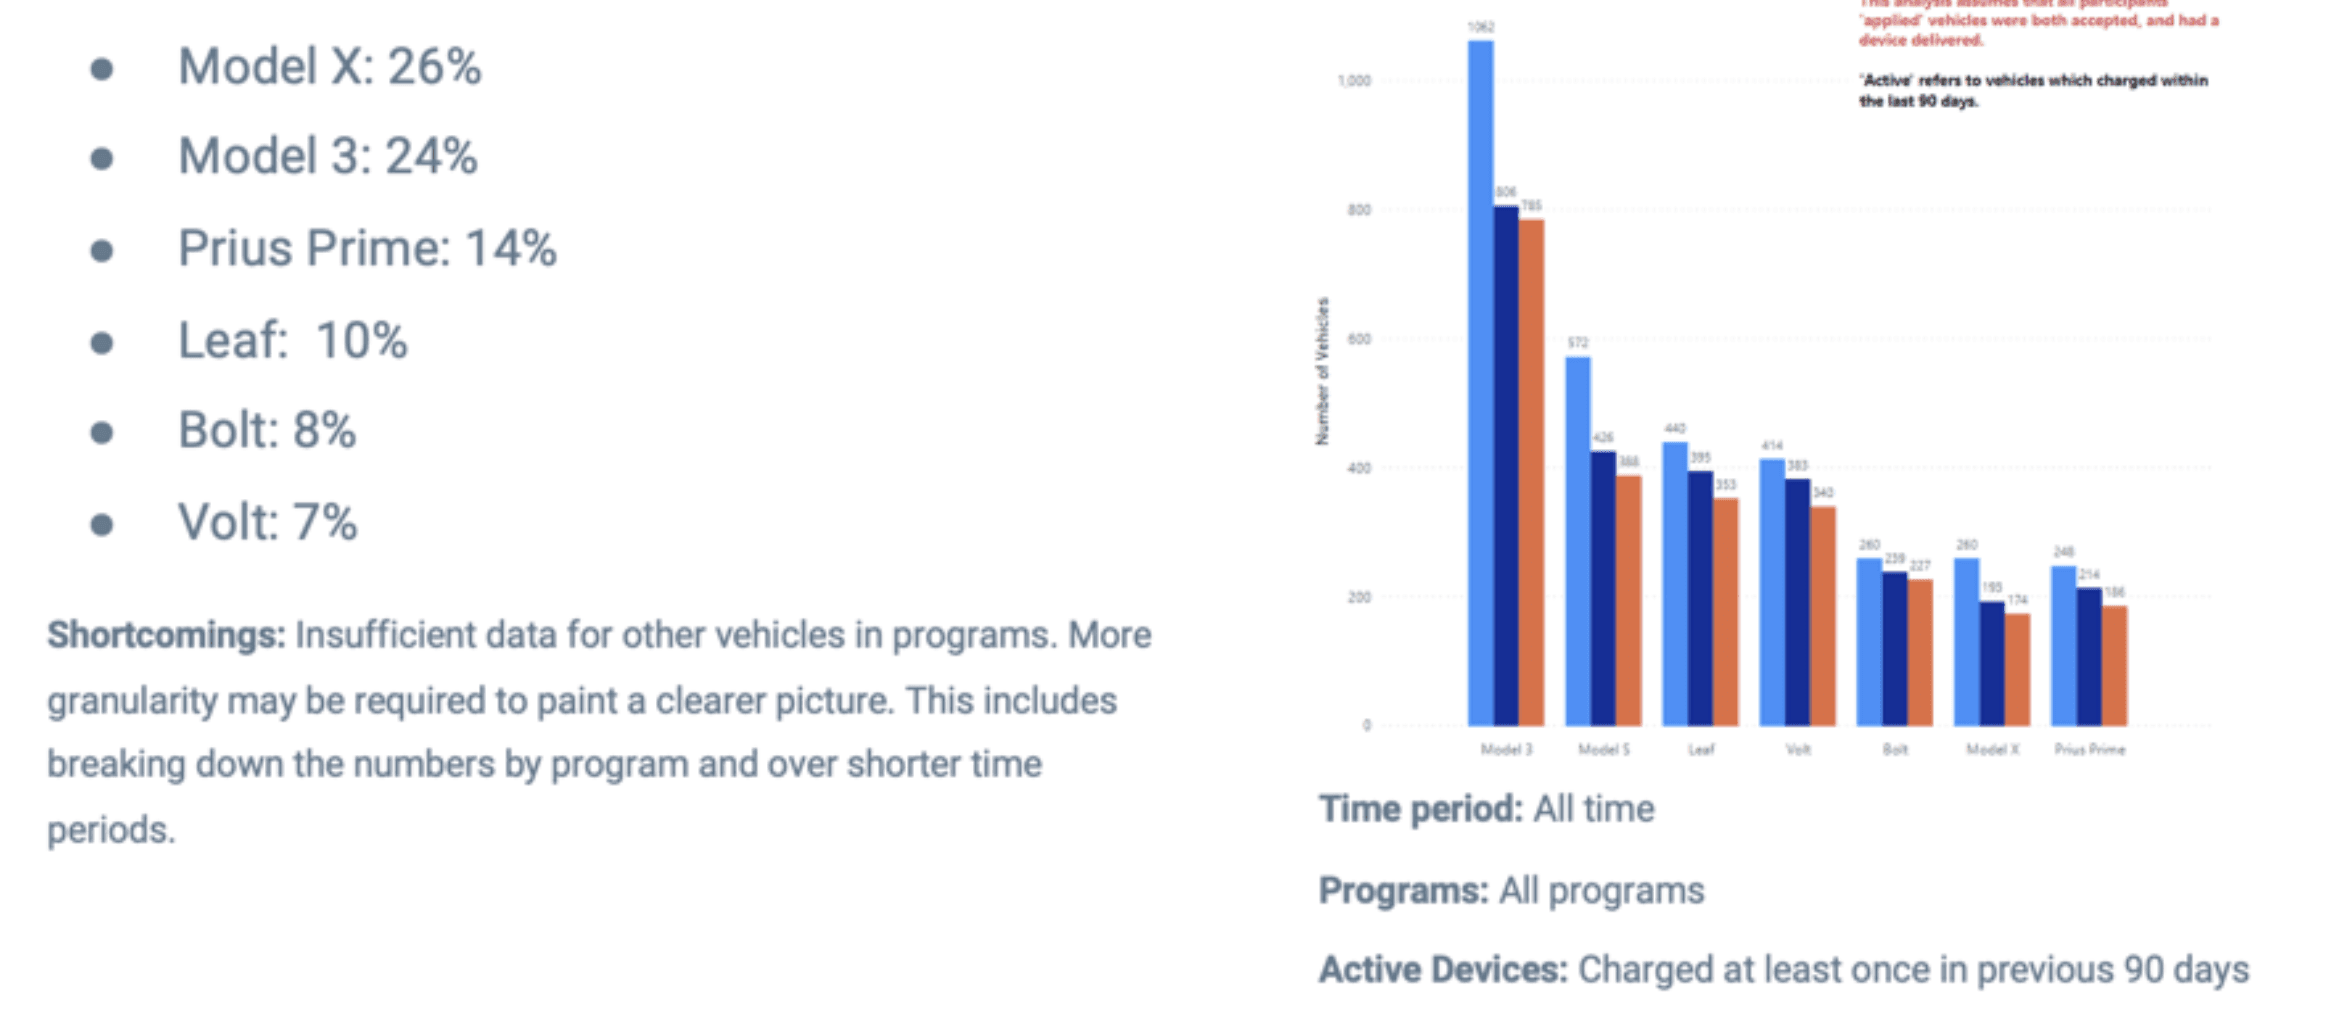
Installation and drop-off by vehicle model, with Tesla models highest
Why People Were Dropping Off
With the size and the where established, I needed the why. I pulled the customer-support feedback tied to non-installation and dropouts and analyzed it for the most common reasons. Four stood out: people didn't know how to install the device, didn't have the time, struggled with the installation method itself, or had privacy concerns about the data it collected.
These became the focus for the rest of the research.
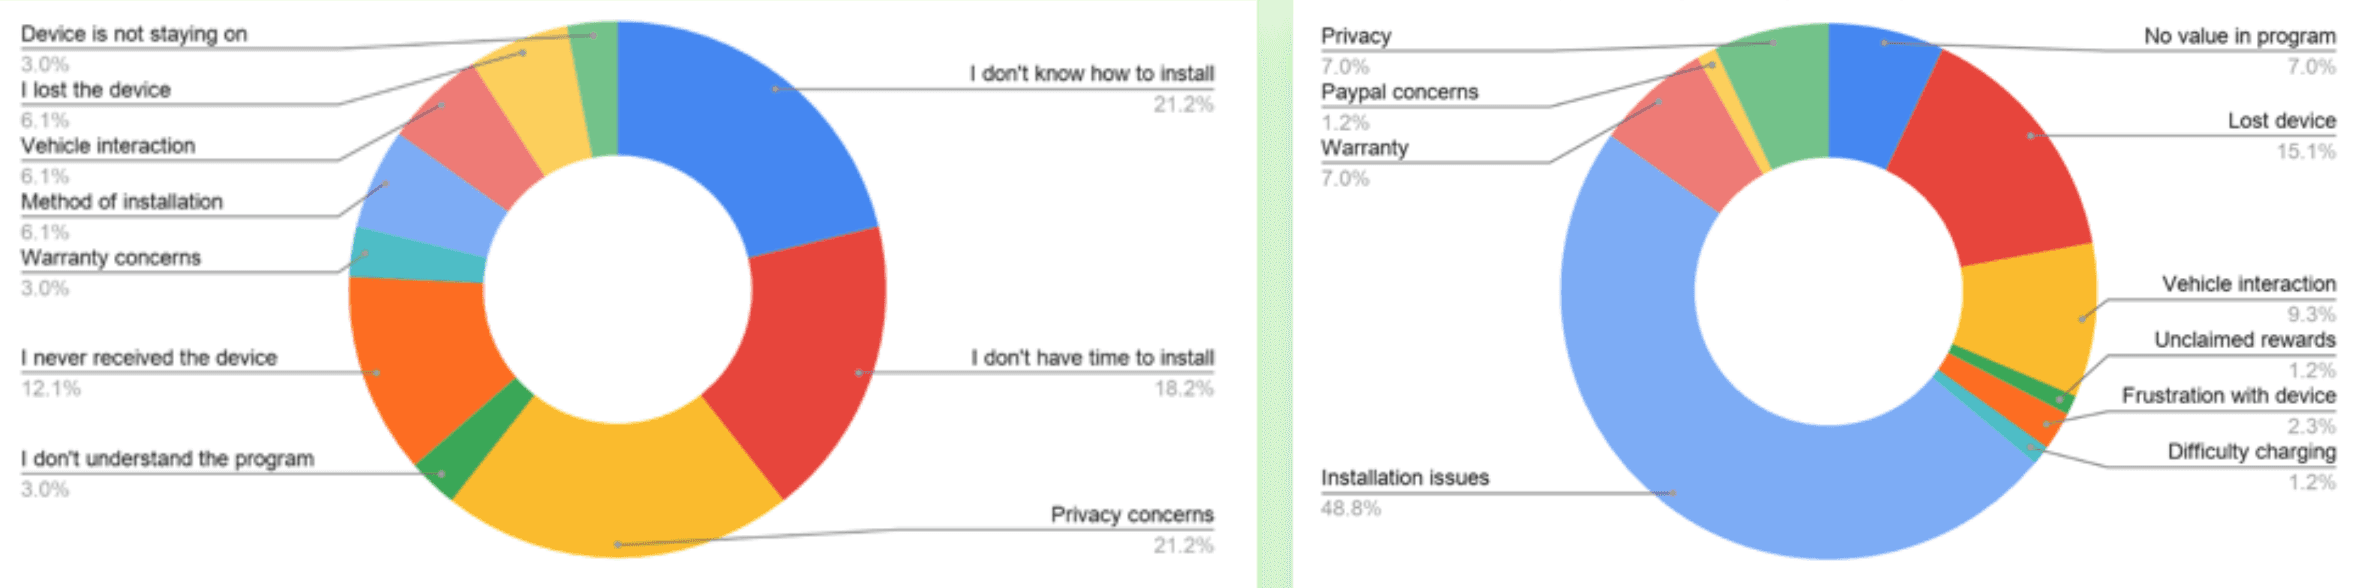
Top reasons participants gave for not installing or dropping out
Seeing It From the User's Side
The support data pointed at time and not knowing how, but we believed our instructions were already clear, so something was missing. To see it directly, I ran in-person interviews and watched drivers install the device themselves.
The key insight came from watching rather than asking. The installation manual looked long and complicated, so drivers assumed the job would take far longer than it actually did and kept putting it off. The real barrier was perceived effort, not the difficulty of the task. That reframed the problem from "people don't have time" into something we could design against.
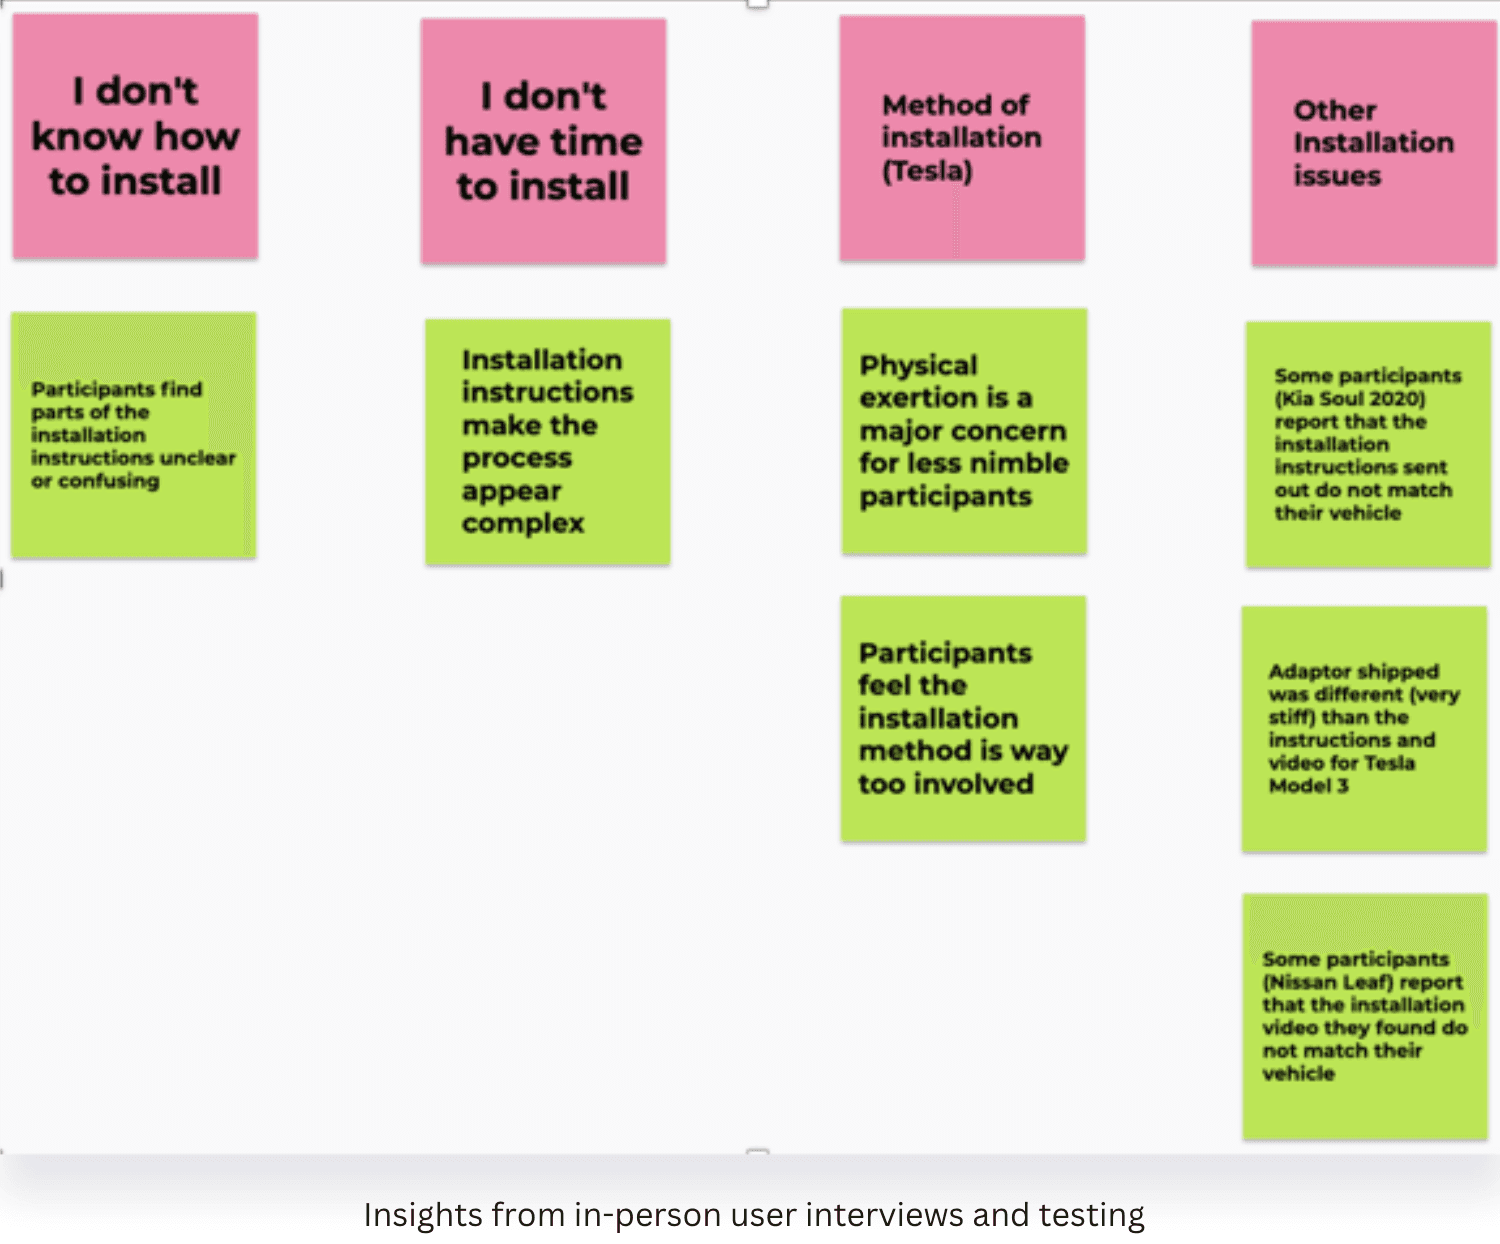
Interviews and observation: the manual made installation feel harder than it was
Prioritizing What to Do
With the real barrier identified, I ran a brainstorming session with the team and mapped every idea on an impact-effort matrix, so we backed the changes that would move installation most for the least lift rather than the most popular suggestion in the room.
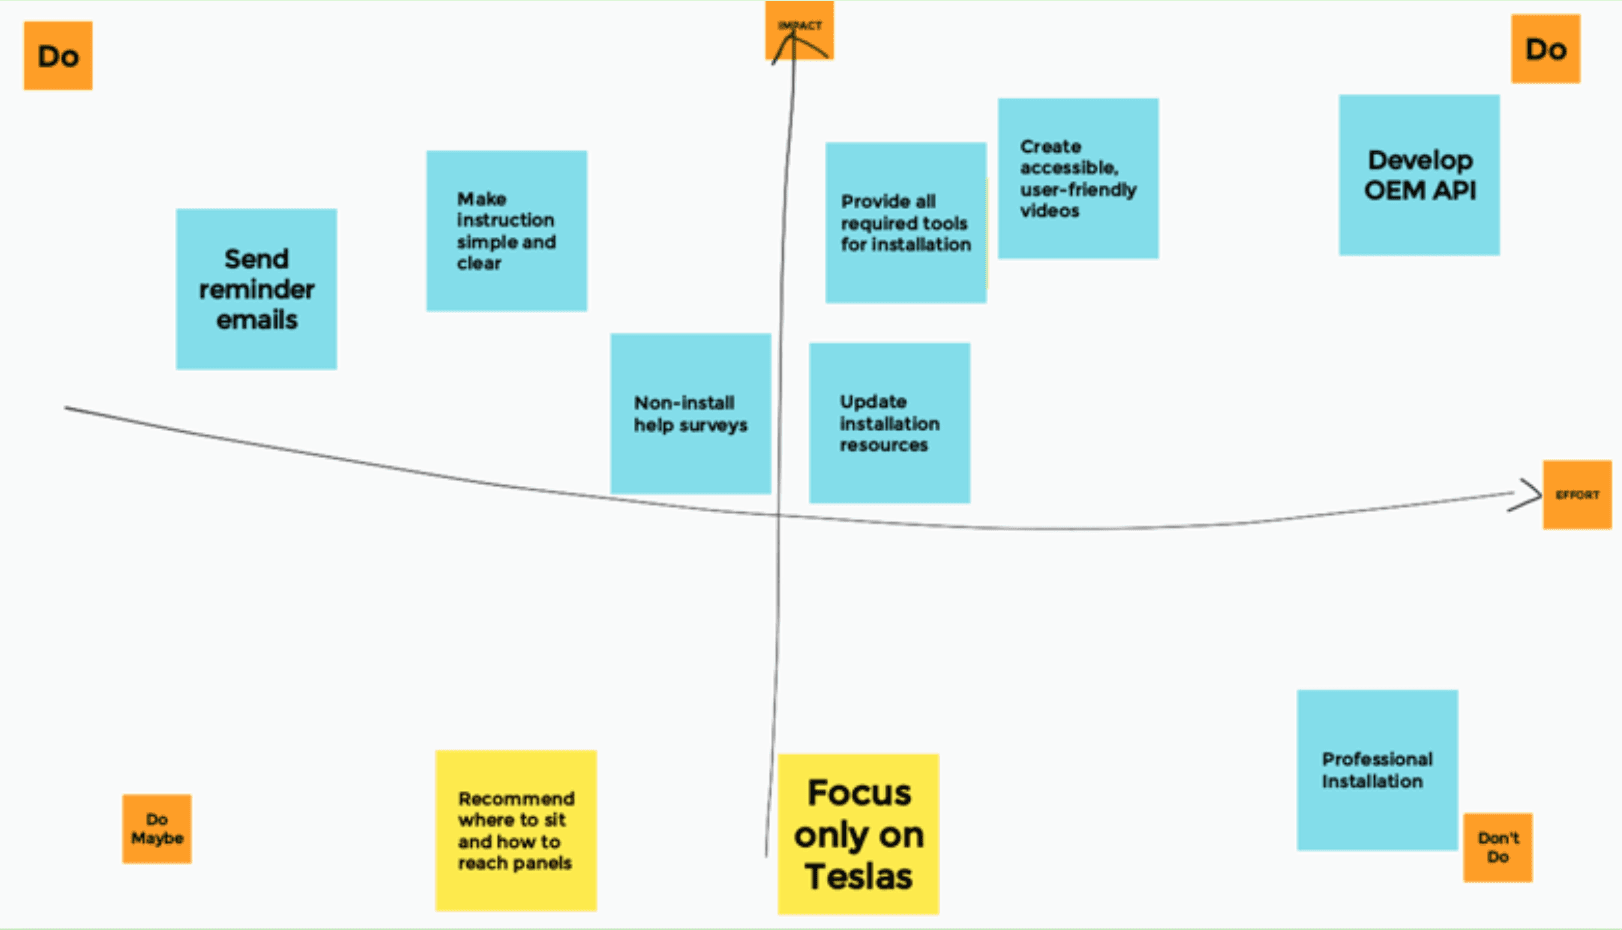
Impact-effort matrix used to prioritize the recommendations
Recommendations and What Shipped
The research produced a prioritized set of recommendations, each aimed at lowering perceived effort or removing a specific barrier:
The recommendations
- Redesigned instruction manual so the task looks as quick as it is.
- Vehicle-specific videos: short, per-vehicle installation walkthroughs, reachable by a QR code in the manual.
- Automated reminder emails with PDF and video instructions, escalating to a survey that routes stuck users to help for their specific issue.
- Instruction A/B testing to keep improving the manual against real results.
- Ship every needed tool in the box, so no one needs a hardware-store trip mid-install.
What shipped first
The team implemented the two highest-leverage changes first: the redesigned manual and the per-vehicle videos. The new manual broke installation into four clear steps with a linked walkthrough video, attacking the perceived-effort problem the interviews surfaced. The remaining recommendations stayed on the roadmap as the next round.
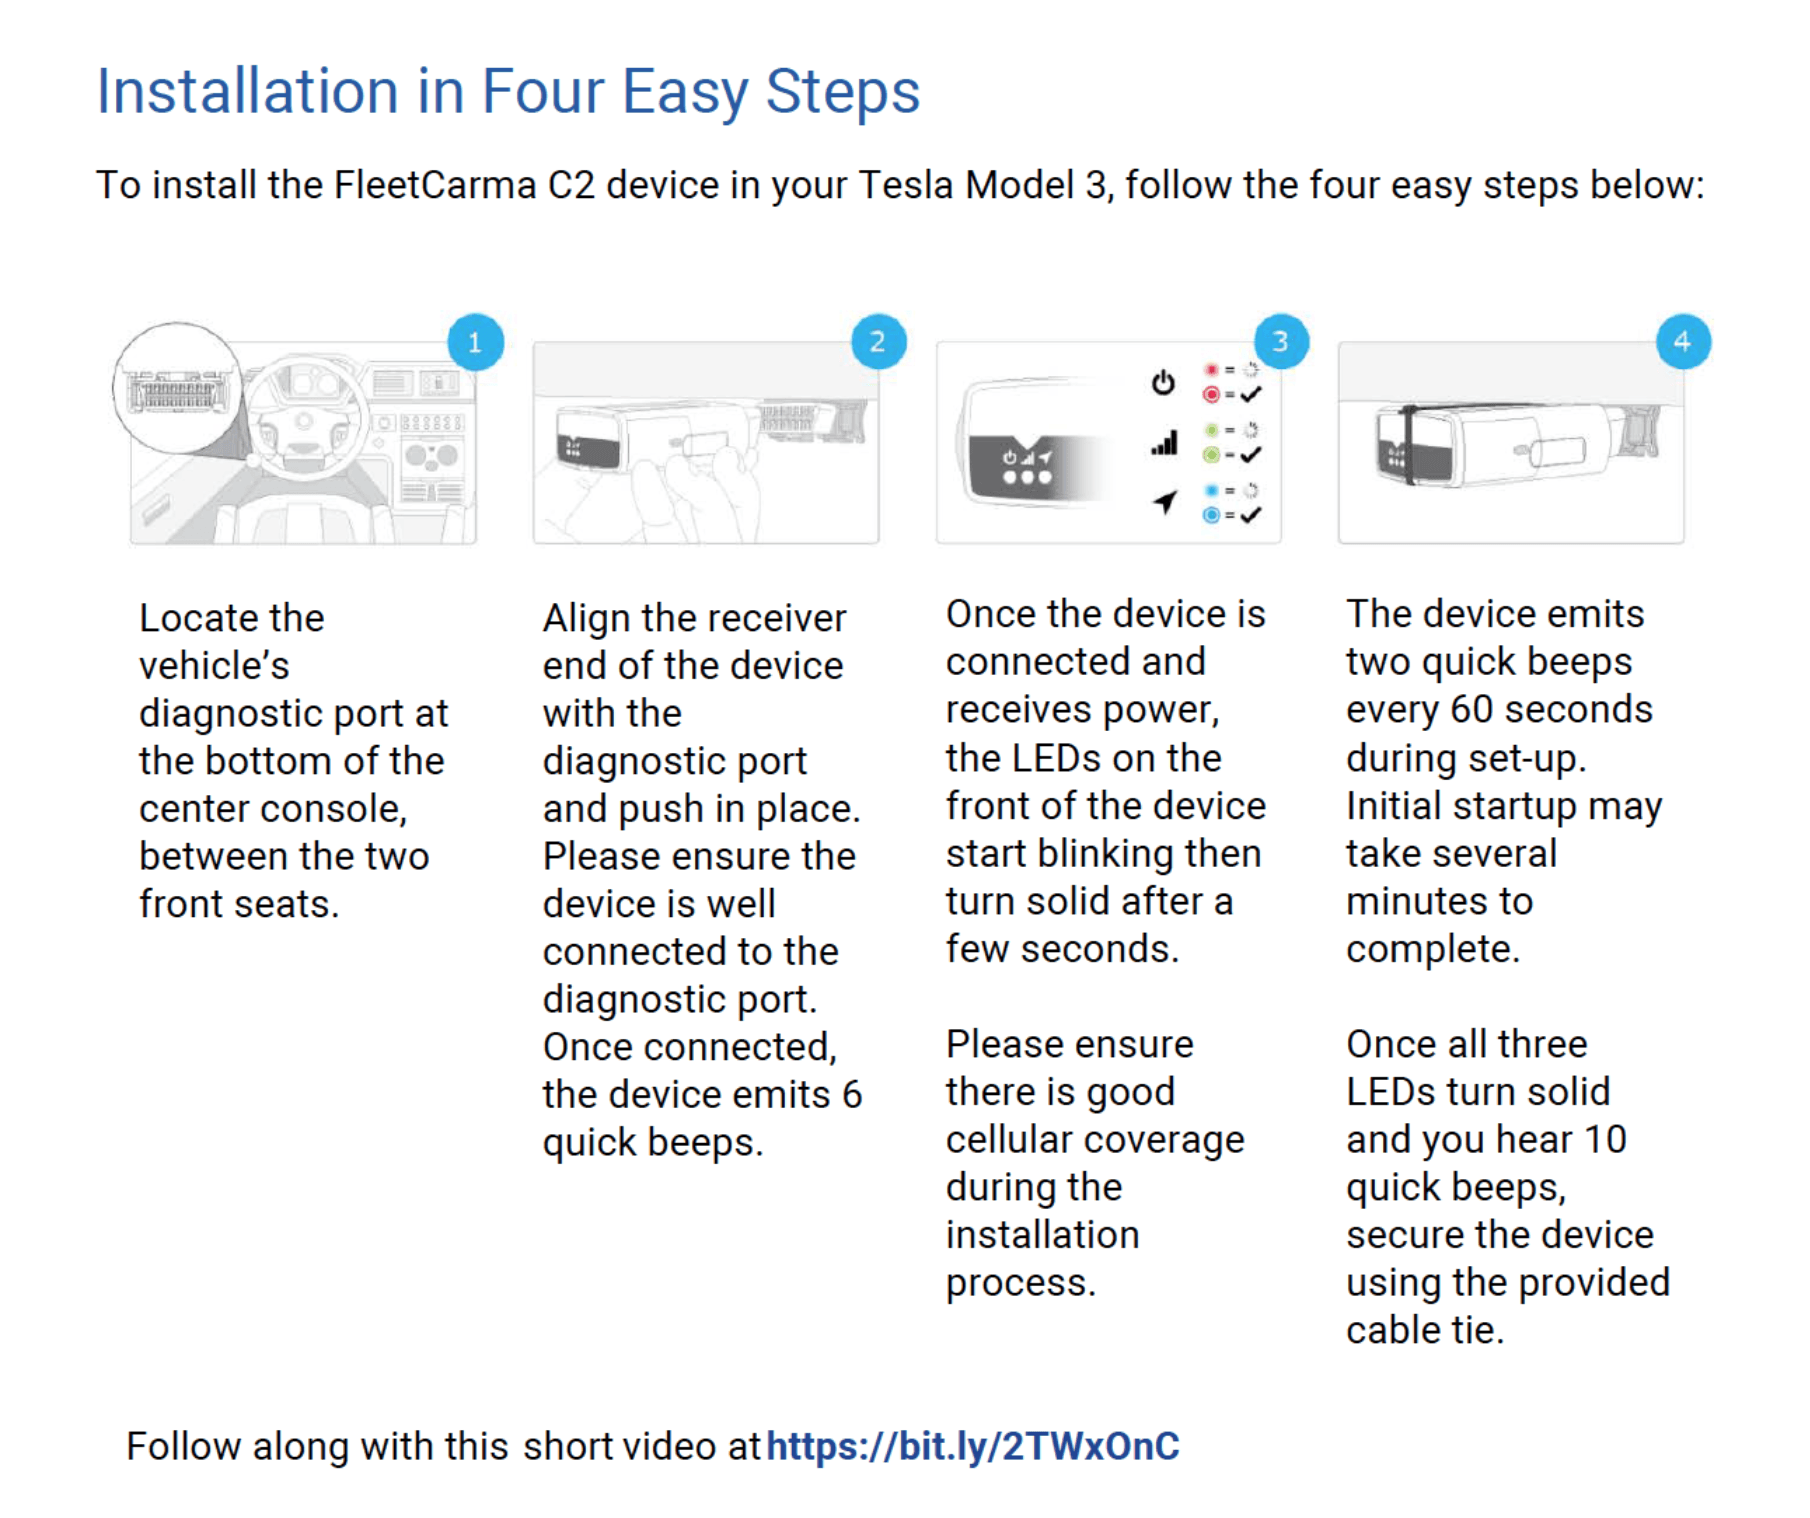
The redesigned manual: installation in four simple steps
Impact
Implementing the redesigned manual and the per-vehicle videos raised average device installation rates by 12%, above the benchmark the team set at the start. For the utilities funding SmartCharge, that is a direct gain in the grid data they were paying for, from changes that cost little to ship.
The more durable result was how the research reframed the problem. "People don't have time" became "the manual makes installation look harder than it is," a barrier the team could actually act on, and the funnel-plus-segment approach gave the program a repeatable way to size a problem and aim its effort.